Growth and statistics of Plastic Surgery and it’s relation to our practice in Modesto, CA
ASPS (American Society of Plastic Surgeons) Released its 2012 Plastic Surgery Statistics Report.
Here are the key highlights of the report as it relates to our Plastic Surgery Practice in Modesto: Surgical Artistry led by Dr. Tammy Wu, MD Board Certified Plastic Surgeon and member of the ASPS.
At the bottom of this post, I compare my own minimally invasive cosmetic procedure (ie. Botox, Veins, Fillers, chemical peels, microdermabrasion) data from Modesto, CA to the national ASPS data. I am not an ASPS member. Only Dr. Tammy Wu is an ASPS member.
All statistics here is 2012 vs 2011 data from the ASPS.
Cosmetic Procedures For 2012:
- Cosmetic Procedures: Cosmetic Surgeries vs. Minimally Invasive Procedures:
- Cosmetic Surgeries were down 2%
- Minimally invasive cosmetic procedures were up 6%
- But both considered procedures, there’s an overall increase of 5%
Plastic Surgery is growing equally for men and women
- Cosmetic procedures performed on men and women are up a total of 5%
- Men make up 9% of all cosmetic procedures
Minimally Invasive Cosmetic Procedures Statistics
- Botox is up 8%
- Fillers (Juvederm, Perlane, Restylane, Radiesse) are up 5%
- Chemical peels up 2%
- All Minimally invasive cosmetic procedures is up 6%
Breast Augmentation
- Continues to be the top cosmetic surgical procedure and has been since 2006.
- Silicone implants were used 62% of the time (saline used 38%) in all breast augmentation in 2012
2012 Top 5 cosmetic Surgical Procedures
- Breast augmentation down 7%
- Nose reshaping no change
- Eyelid surgery up 4%
- Liposuction up 1%
- Facelift up 6%
2012 Top 5 cosmetic Minimally Invasive Procedures
- Botox (Botulinum toxin type A) up 8% (6.1 million injections)
- Soft tissue fillers up 5%
- Chemical Peel up 2%
- Laser Hair removal up 4%
- Microdermabrasion up 8%
Other Minimally Invasive Cosmetic Procedures
- Laser vein therapy is down -2%
- Sclerotherapy is up 1%
- Fat injections is down 8%
- Cellulite treatment is down 13%
Age Demographics: 40-54 years old
- 40-54 year olds is the group that makes the majority of all cosmetic procedures
- 48% of the total
My own thoughts
FaceBook targeted demographic ads for plastic surgeons
- It aids in marketing efforts. Perhaps we could concentrate more around the age of 40-54 years olds in the marketing. In FaceBook for example, ages could be targeted. Thus selecting 40-54 as an age selection in FaceBook might be beneficial for plastic surgeons.
How does our Minimally Invasive Cosmetic Practice compare?
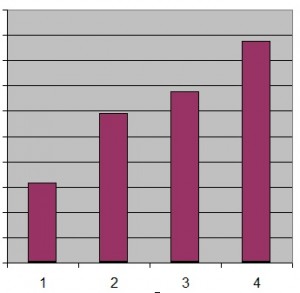
- Bar 1 represents 2009, Bar 2 is 2010, Bar 3 is 2011, and Bar 4 is 2012 (last year) for my minimally invasive cosmetic surgery practice.
- Our Minimally invasive practice increased 29% last year compared to the national increase 6%. We have not yet compiled our data for surgeries. Dr. Wu has access to that data. I have access to my data and this is my blog.
- The growth between bars (1-4) respectively: 42%, 23%, 29%
- I just did our own analysis of Surgical Artistry Cosmetic popularity based on zip codes

