Category Archives: Statistics

Most Popular Browser

browser

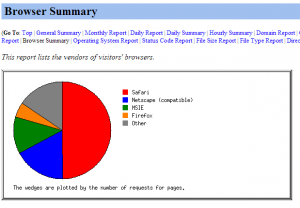
Safari is now the most popular browser by far

The statistics show that Safari is the most popular web browser coming to our Modesto Plastic Surgery websites.  I did the analysis for the last 18 days in April of 2013.  I hadn’t looked at this chart in years.  I still remember MSIE (Internet Explorer – Microsoft) being the dominant player for the longest time.  I think this is probably due to the popularity of iphones and ipads.  The other category is large too, but unfortunately it doesn’t show the breakdown.  The statistics program that figured these things out are old.  Perhaps Google Analytics has some data regarding this which is more up to date – I would imagine that if it were present in Google Analytics, there would be a listing for Google’s Chrome Browser.  On the chart above, I’m not entirely sure what is Netscape compatible.  But this data is generated from DreamHost where I keep some of my webpages.  That includes this blog.


2012 Plastic Surgery Statistics Report by ASPS: Top procedures & Top age groups

Growth and statistics of Plastic Surgery and it’s relation to our practice in Modesto, CA

ASPS (American Society of Plastic Surgeons) Released its 2012 Plastic Surgery Statistics Report.

Here are the key highlights of the report as it relates to our Plastic Surgery Practice in Modesto: Surgical Artistry led by Dr. Tammy Wu, MD Board Certified Plastic Surgeon and member of the ASPS.

At the bottom of this post, I compare my own minimally invasive cosmetic procedure (ie. Botox, Veins, Fillers, chemical peels, microdermabrasion) data from Modesto, CA to the national ASPS data.  I am not an ASPS member.  Only Dr. Tammy Wu is an ASPS member.

All statistics here is 2012 vs 2011 data from the ASPS.

Cosmetic Procedures For 2012:

  • Cosmetic Procedures:  Cosmetic Surgeries vs. Minimally Invasive Procedures:
  • Cosmetic Surgeries were down 2%
  • Minimally invasive cosmetic procedures were up 6%
  • But both considered procedures, there’s an overall increase of 5%

Plastic Surgery is growing equally for men and women

  • Cosmetic procedures performed on men and women are up a total of 5%
  • Men make up 9% of all cosmetic procedures

Minimally Invasive Cosmetic Procedures Statistics

Breast Augmentation

  • Continues to be the top cosmetic surgical procedure and has been since 2006.
  • Silicone implants were used 62% of the time (saline used 38%) in all breast augmentation in 2012

2012 Top 5 cosmetic Surgical Procedures

  • Breast augmentation down 7%
  • Nose reshaping no change
  • Eyelid surgery up 4%
  • Liposuction up 1%
  • Facelift up 6%

2012 Top 5 cosmetic Minimally Invasive Procedures

  • Botox (Botulinum toxin type A) up 8% (6.1 million injections)
  • Soft tissue fillers up 5%
  • Chemical Peel up 2%
  • Laser Hair removal up 4%
  • Microdermabrasion up 8%

Other Minimally Invasive Cosmetic Procedures

  • Laser vein therapy is down -2%
  • Sclerotherapy is up 1%
  • Fat injections is down 8%
  • Cellulite treatment is down 13%

Age Demographics: 40-54 years old

  • 40-54 year olds is the group that makes the majority of all cosmetic procedures
  • 48% of the total


My own thoughts

FaceBook targeted demographic ads for plastic surgeons

  • It aids in marketing efforts.  Perhaps we could concentrate more around the age of 40-54 years olds in the marketing.  In FaceBook for example, ages could be targeted.  Thus selecting 40-54 as an age selection in FaceBook might be beneficial for plastic surgeons.

How does our Minimally Invasive Cosmetic Practice compare?

Chart of Dr. Lee's practice

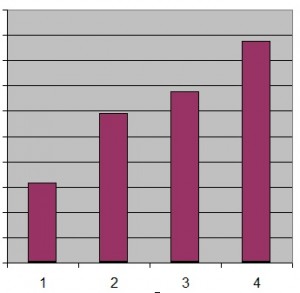
Growth of my minimally invasive Cosmetic practice in Modesto, CA from 2009-2012

  • Bar 1 represents 2009, Bar 2 is 2010, Bar 3 is 2011, and Bar 4 is 2012 (last year) for my minimally invasive cosmetic surgery practice.
  • Our Minimally invasive practice increased 29% last year compared to the national increase 6%.  We have not yet compiled our data for surgeries.  Dr. Wu has access to that data.  I have access to my data and this is my blog.
  • The growth between bars (1-4) respectively: 42%, 23%, 29%
  • I just did our own analysis of Surgical Artistry Cosmetic popularity based on zip codes


Top 10 Zip Codes coming to Surgical Artistry: Ripon, Turlock, Oakdale, More

zip Town
95356 Modesto 10%
95355 Modesto 18%
95357 Modesto 3%
95350 Modesto 10%
95361 Oakdale 6%
95326 Hughson 1%
95367 Riverbank 4%
95354 Modesto 4%
95366 Ripon 2%
95382 Turlock 5%
Total 62%

The percentages shown is a percent of the total number of patients seen at Surgical Artistry from inception in 2006 to 4/27/13.  Sorted based on percentage of population served per zip code.  Population data is in the chart below.  95355 is our zip code of our plastic surgery office (2336 Sylvan Ave. Suite C, Modesto, CA 95355).

Let’s not forget about Oakdale, Hughson, Riverbank, Ripon, and Turlock.

I guess it’s no big surprise that most of our patients come from Modesto, because we are located in Modesto.

44% of our patients come from Modesto and the remaining popular cities making up 18% of our patients come from:  Oakdale, Hughson, Riverbank, Ripon, and Turlock.

I like to exercise my knowledge of spreadsheets

Spreadsheets are very useful for keeping track of medical data, especially for experiments.  I value spreadsheet skills as a doctor, and feel that if I can efficiently track things, I can eventually improve upon them.

Today I practiced using a pivot table to extract data from our electronic medical record.  I figured out the top 10 zip codes of our Surgical Artistry Patients (including acupuncture, veins, Botox, fillers, breast augmentation, tummy tucks, and other plastic surgery patients).

I got help from this page on Pivot Tables

http://office.microsoft.com/en-us/excel-help/count-how-often-a-value-occurs-HP001127779.aspx

  1. Select the column containing the data
  2. On the Data menu, click Pivot Table and Pivot Chart
  3. Click Finish
  4. Drag and drop the column label (in this case it was “zip”) into the drop Row Fields Here (from Pivot Table Field List)
  5. Drag and drop the same column label above into the Drop Data Items Here (from Pivot Table Field List)

Zip Codes of various parts of Cities

These were tallied up with an absolute count and I used further spreadsheet skills to convert that into a percentage of our patients.

2010 Census Data

I went to www.zip-codes.com for fun to see the total population and I sorted above chart in order of percentage of the entire population which we served. I didn’t show the data here because it’s boring data.  But for example we could say that of the area code 95356, Surgical Artistry has served about 1.1% of that population.  Below’s chart shows the top 24 zip codes served by Surgical Artistry.  Avg = Average House Cost / Value as determined by 2010 census and source is zip-codes.com.

Zip Town Population Avg House Value
95356 Modesto 32,288  $305,400.00
95355 Modesto 59,031  $247,700.00
95357 Modesto 11,708  $253,500.00
95350 Modesto 51,331  $205,600.00
95361 Oakdale 31,533  $327,200.00
95326 Hughson 8,376  $249,100.00
95367 Riverbank 24,089  $214,300.00
95354 Modesto 25,877  $191,700.00
95366 Ripon 16,857  $352,000.00
95382 Turlock 36,319  $275,900.00
95320 Escalon 12,658  $279,000.00
95368 Salida 13,230  $221,700.00
95358 Modesto 31,086  $215,000.00
95386 Waterford 10,399  $205,100.00
95307 Ceres 44,056  $210,200.00
95360 Newman 12,107  $172,900.00
95363 Patterson 26,709  $216,300.00
95380 Turlock 42,005  $207,000.00
95351 Modesto 47,691  $160,200.00
95370 Sonora 26,210  $308,600.00
95337 Manteca 33,348  $285,300.00
95301 Atwater 37,809  $220,400.00
95340 Merced 33,672  $226,400.00
95336 Manteca 44,655  $243,700.00

Visit our Plastic Surgery Website

Thanks for visiting my self-educational blog.  For serious stuff, please visit our web site:

Surgical Artistry Plastic Surgery Home Page

Bee

Buzzing around looking for zip codes?